Latitude Vs Max Temperature
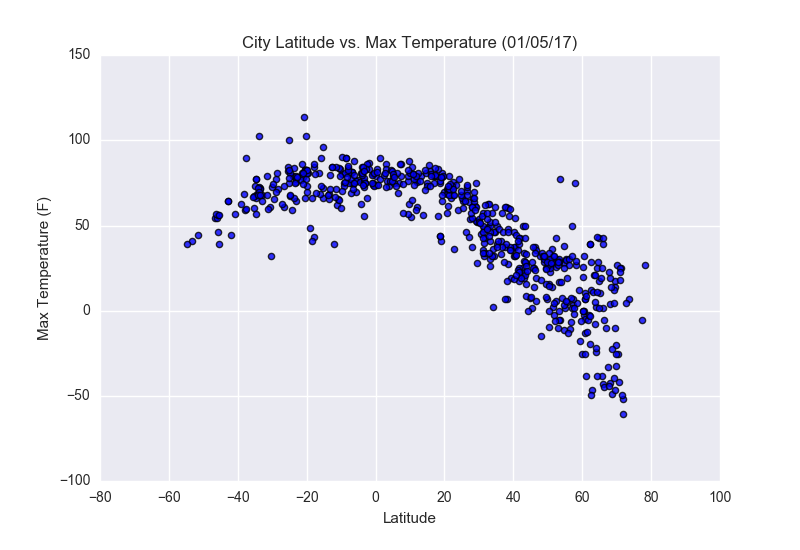
The graph displays a strong correlation between latitude and max temperature of the cities. The trends presented in the graph above were consistent with our prior knowledge. Such that:
- 1). Cities in the in the southern latitude have warmer climates than the cities in the northern climates which have slightly colder weather at the time.
- 2). Cities close to the equator (0° Latitude) are warmer than the cities away from it.
This could be because of the tilt sourthern side of the earth to the sun during this time.
Visualizations